Inside the Sludge: How Experts Run COVID Wastewater Testing Messy But Necessary
Published November 1st, 2022 at 6:00 AM
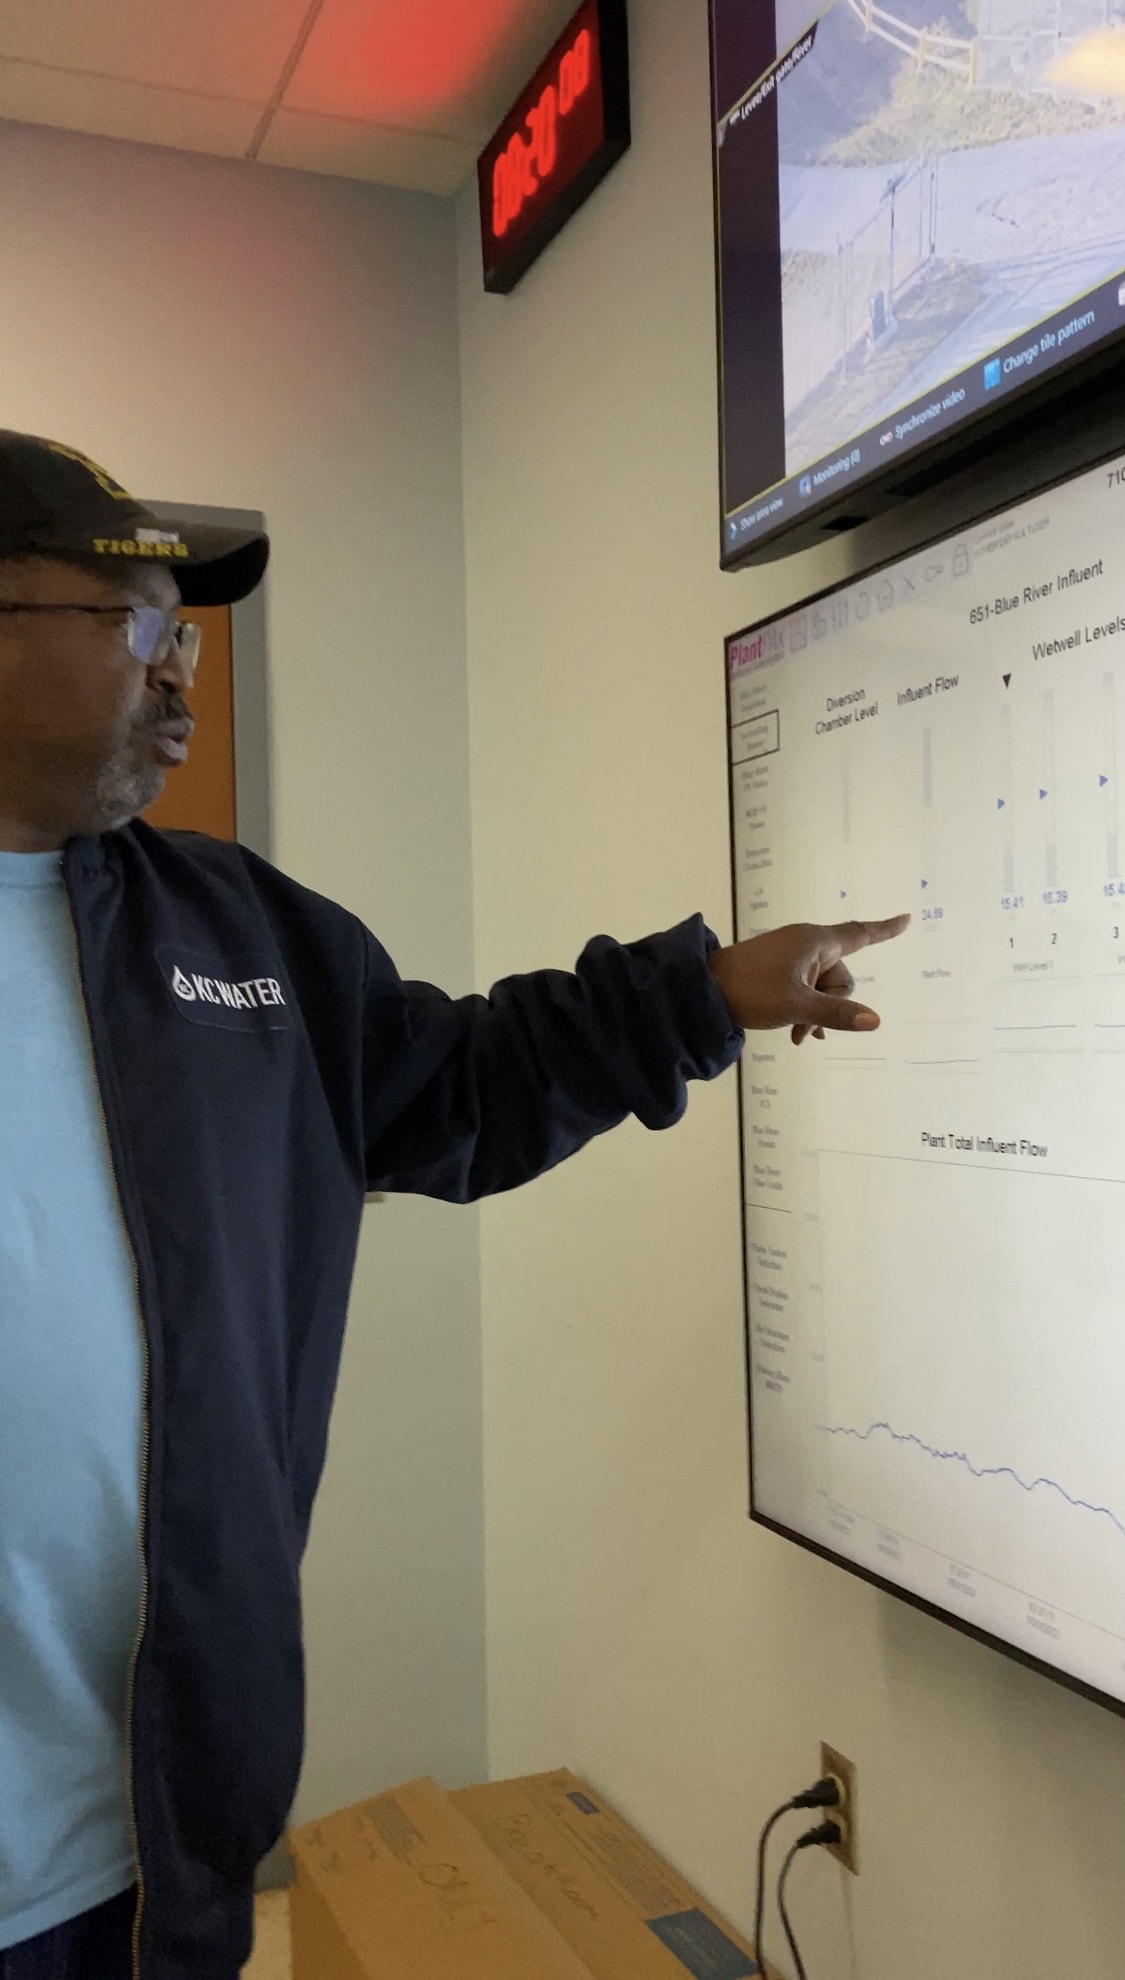
Above image credit: KC Water's chief plant operator Kevin Herman gives a tour of the "Sludge House" and machinery that sifts through the waste. (Vicky Diaz-Camacho | Flatland)Nestled behind railroad tracks along Hawthorne Road in Kansas City, the Blue River Wastewater Treatment Plant doesn’t look like much.
But inside, TV screens on a wall are tracking the flow, locating waste and sifting through it.
Inside one large shed, gargantuan machinery sifts through the “sludge,” the preferred euphemism for solid waste. A quick two-minute drive around back is what’s called the “sludge house.”
“We get everything from Grandview to here,” said Kevin Herman, who is the chief plant operator for KC Water. “Fifty to 60 million gallons.”
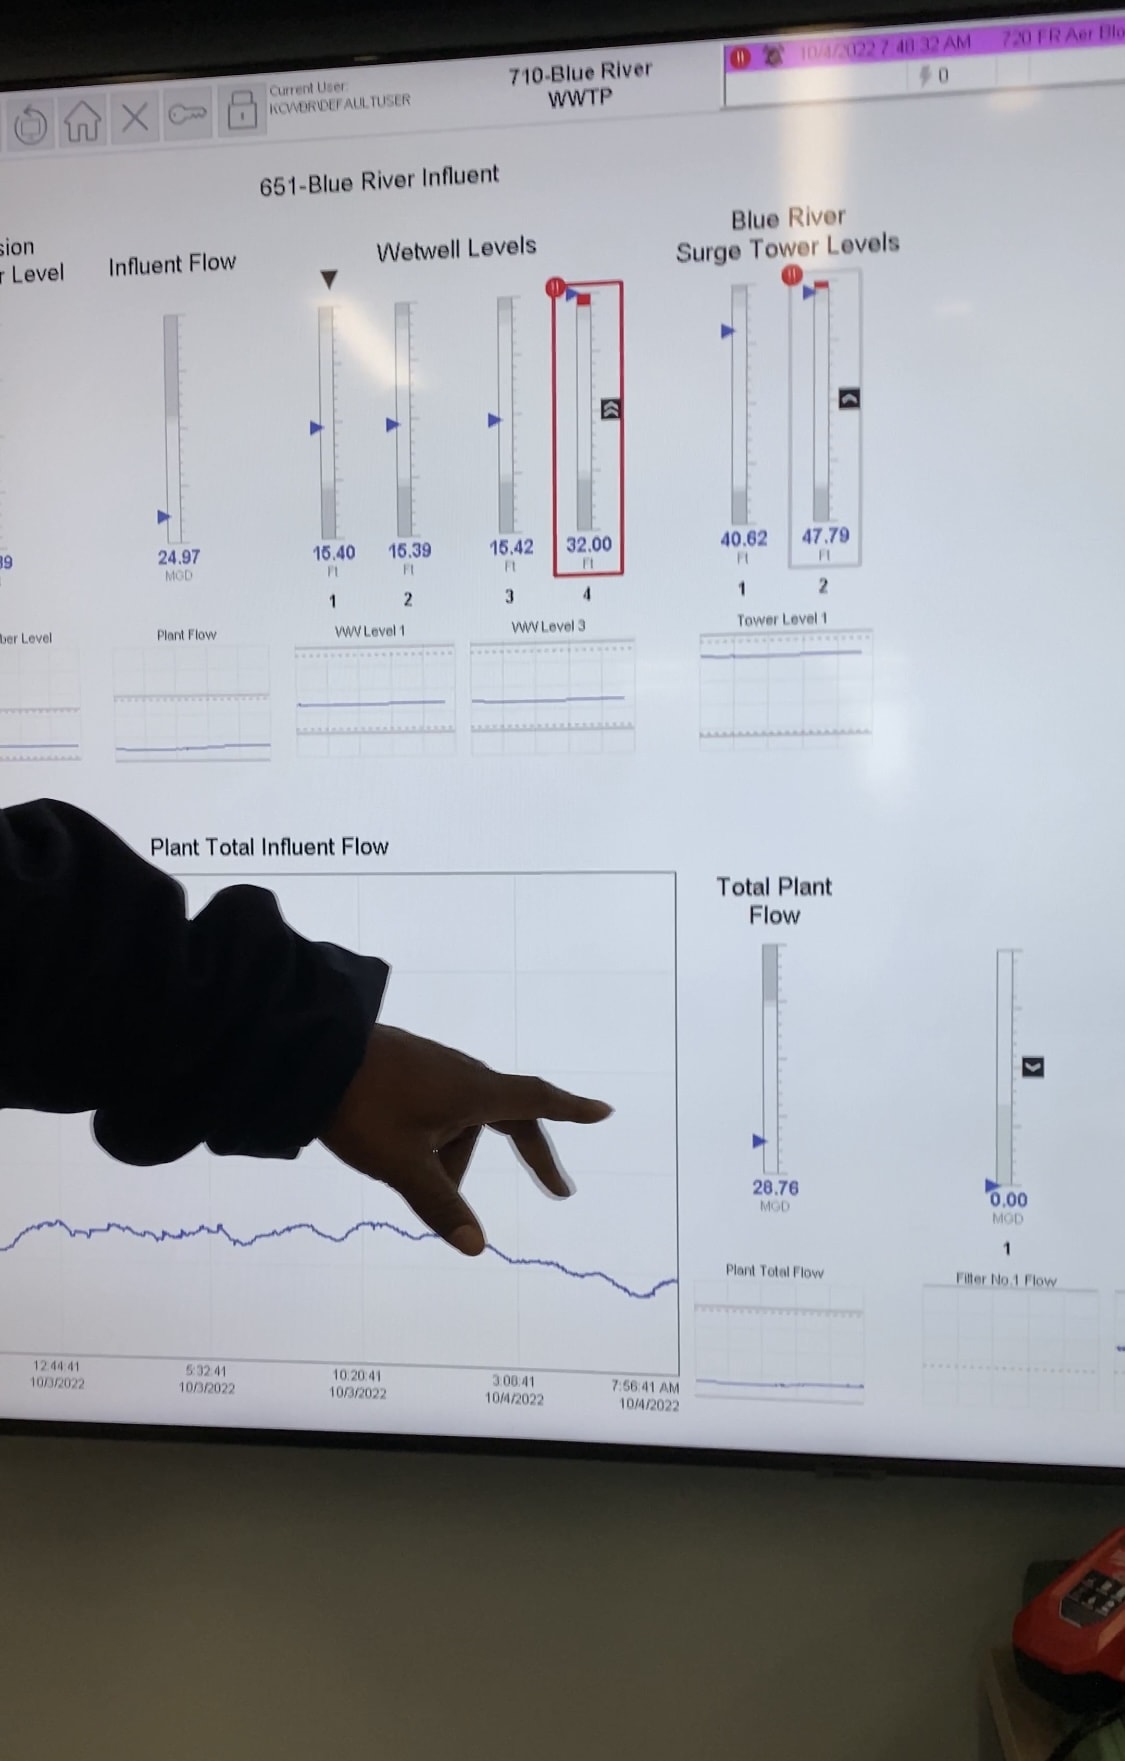
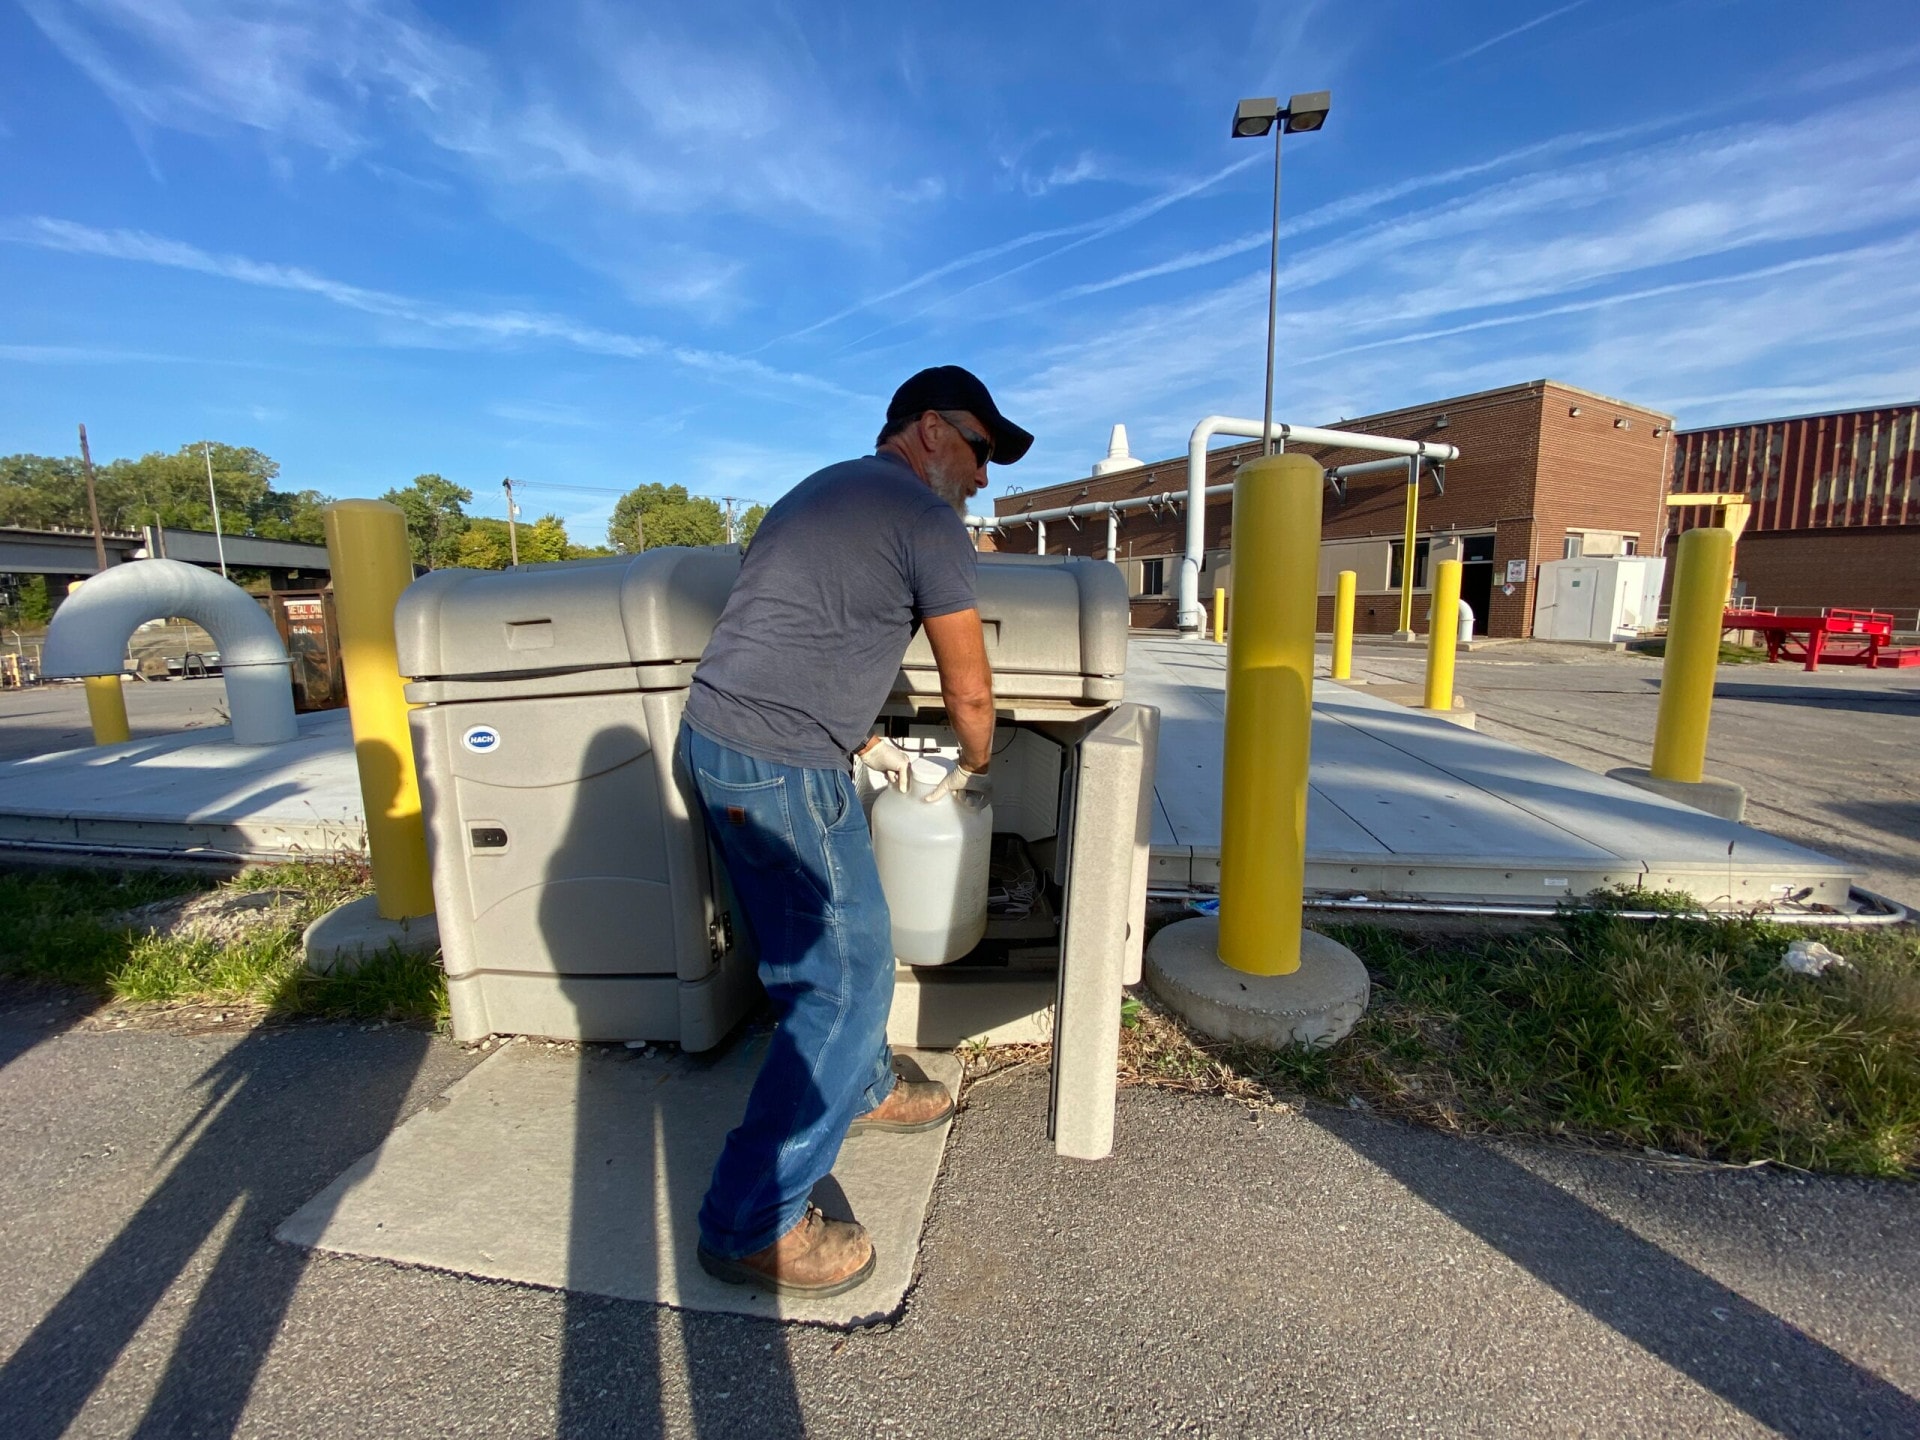
Streams of water flow to the facility through a canal and then through a pipe underground. Operators who work the site open what looks like a mini plastic shed. The liquid then goes into a larger container where operators retrieve samples.
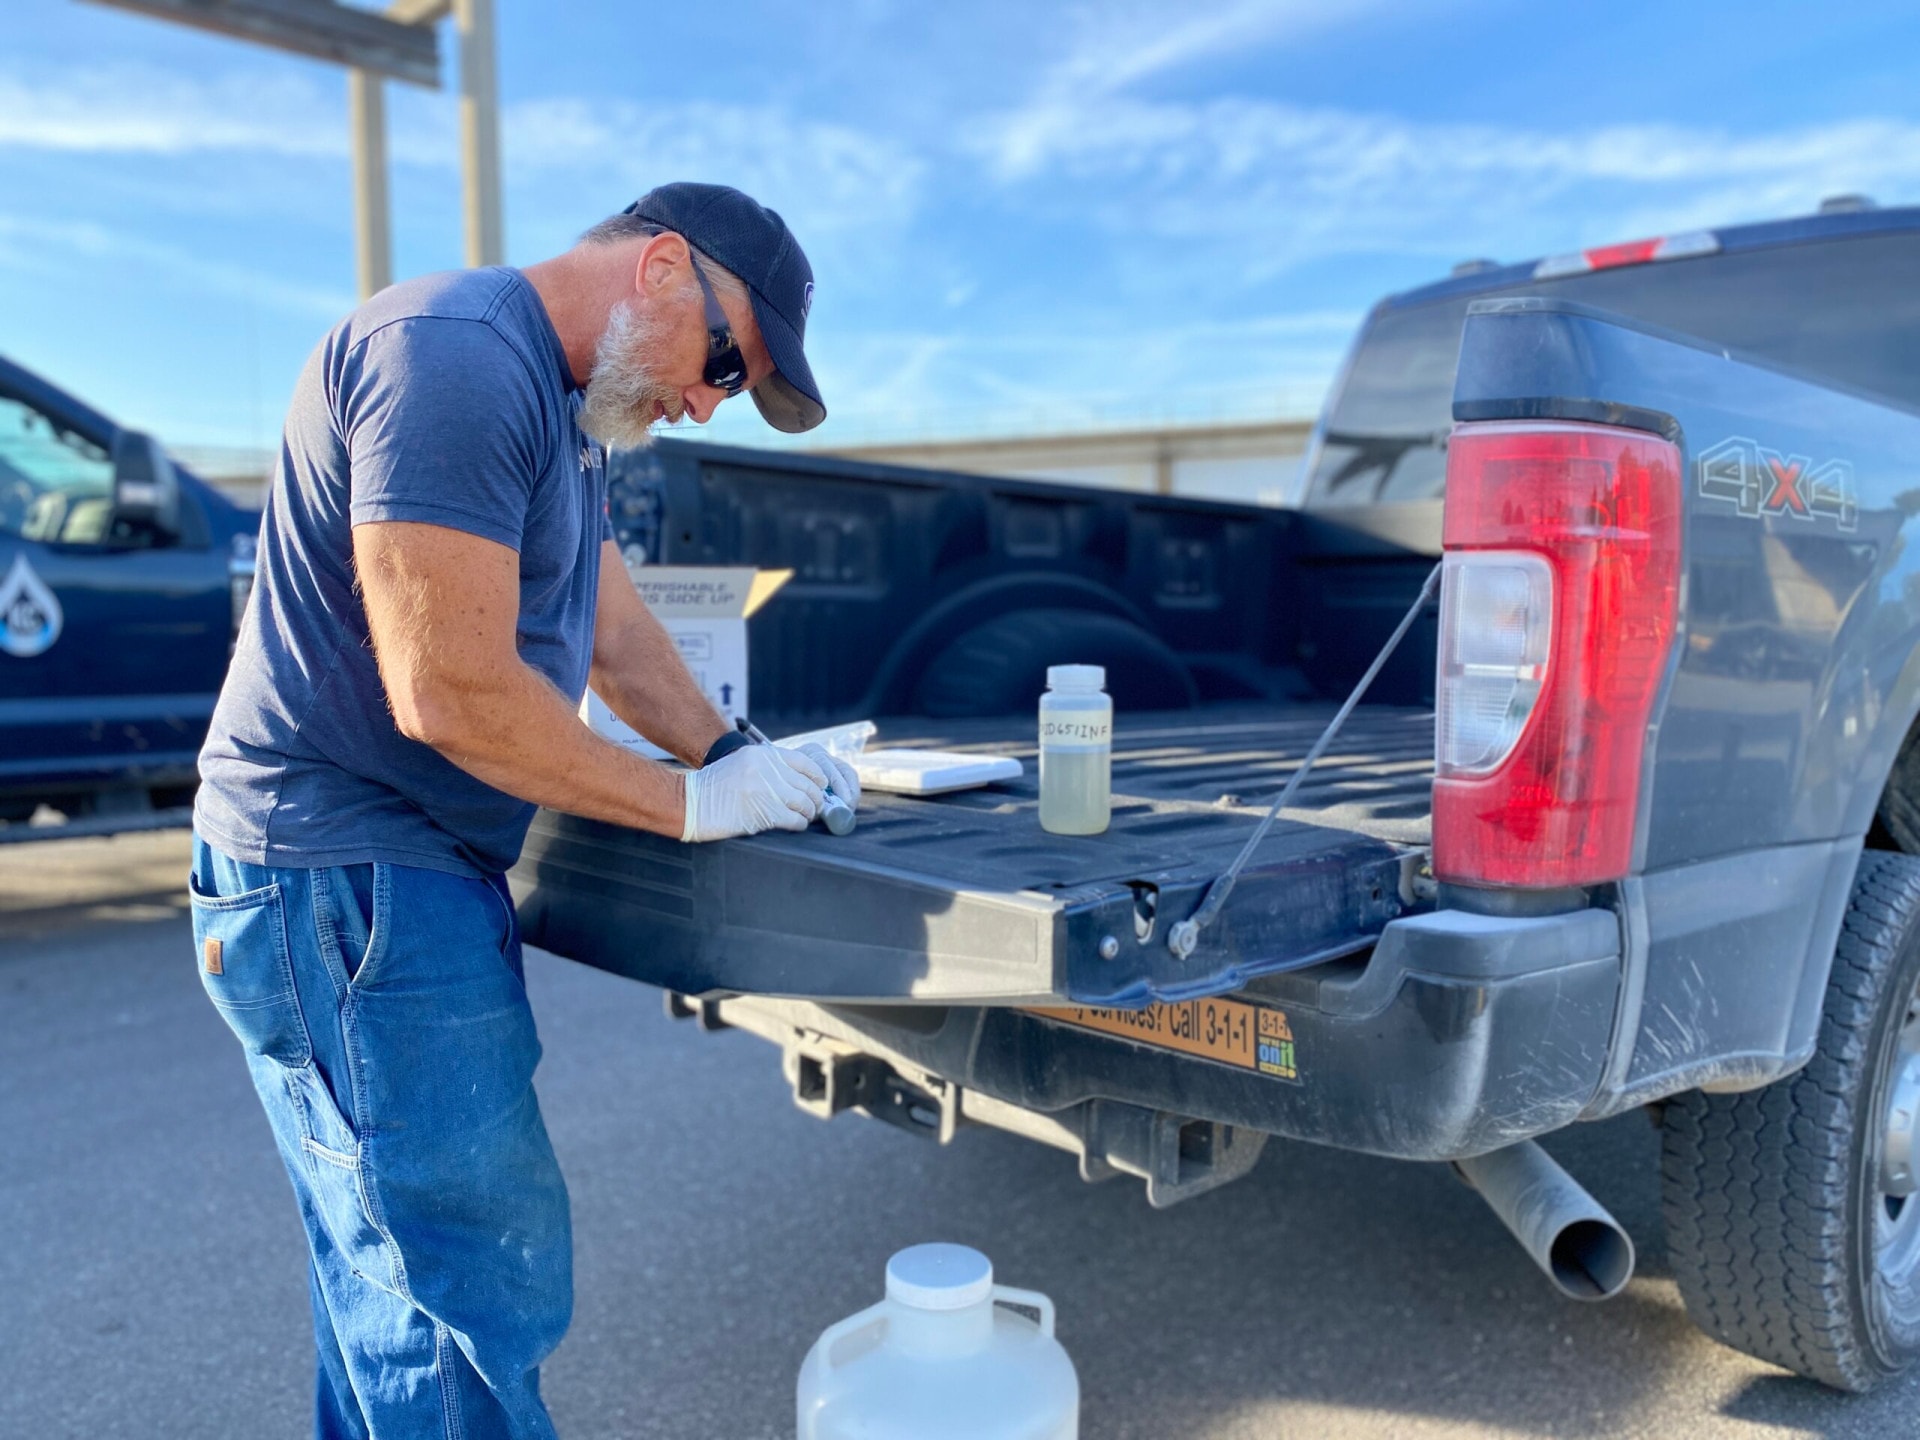
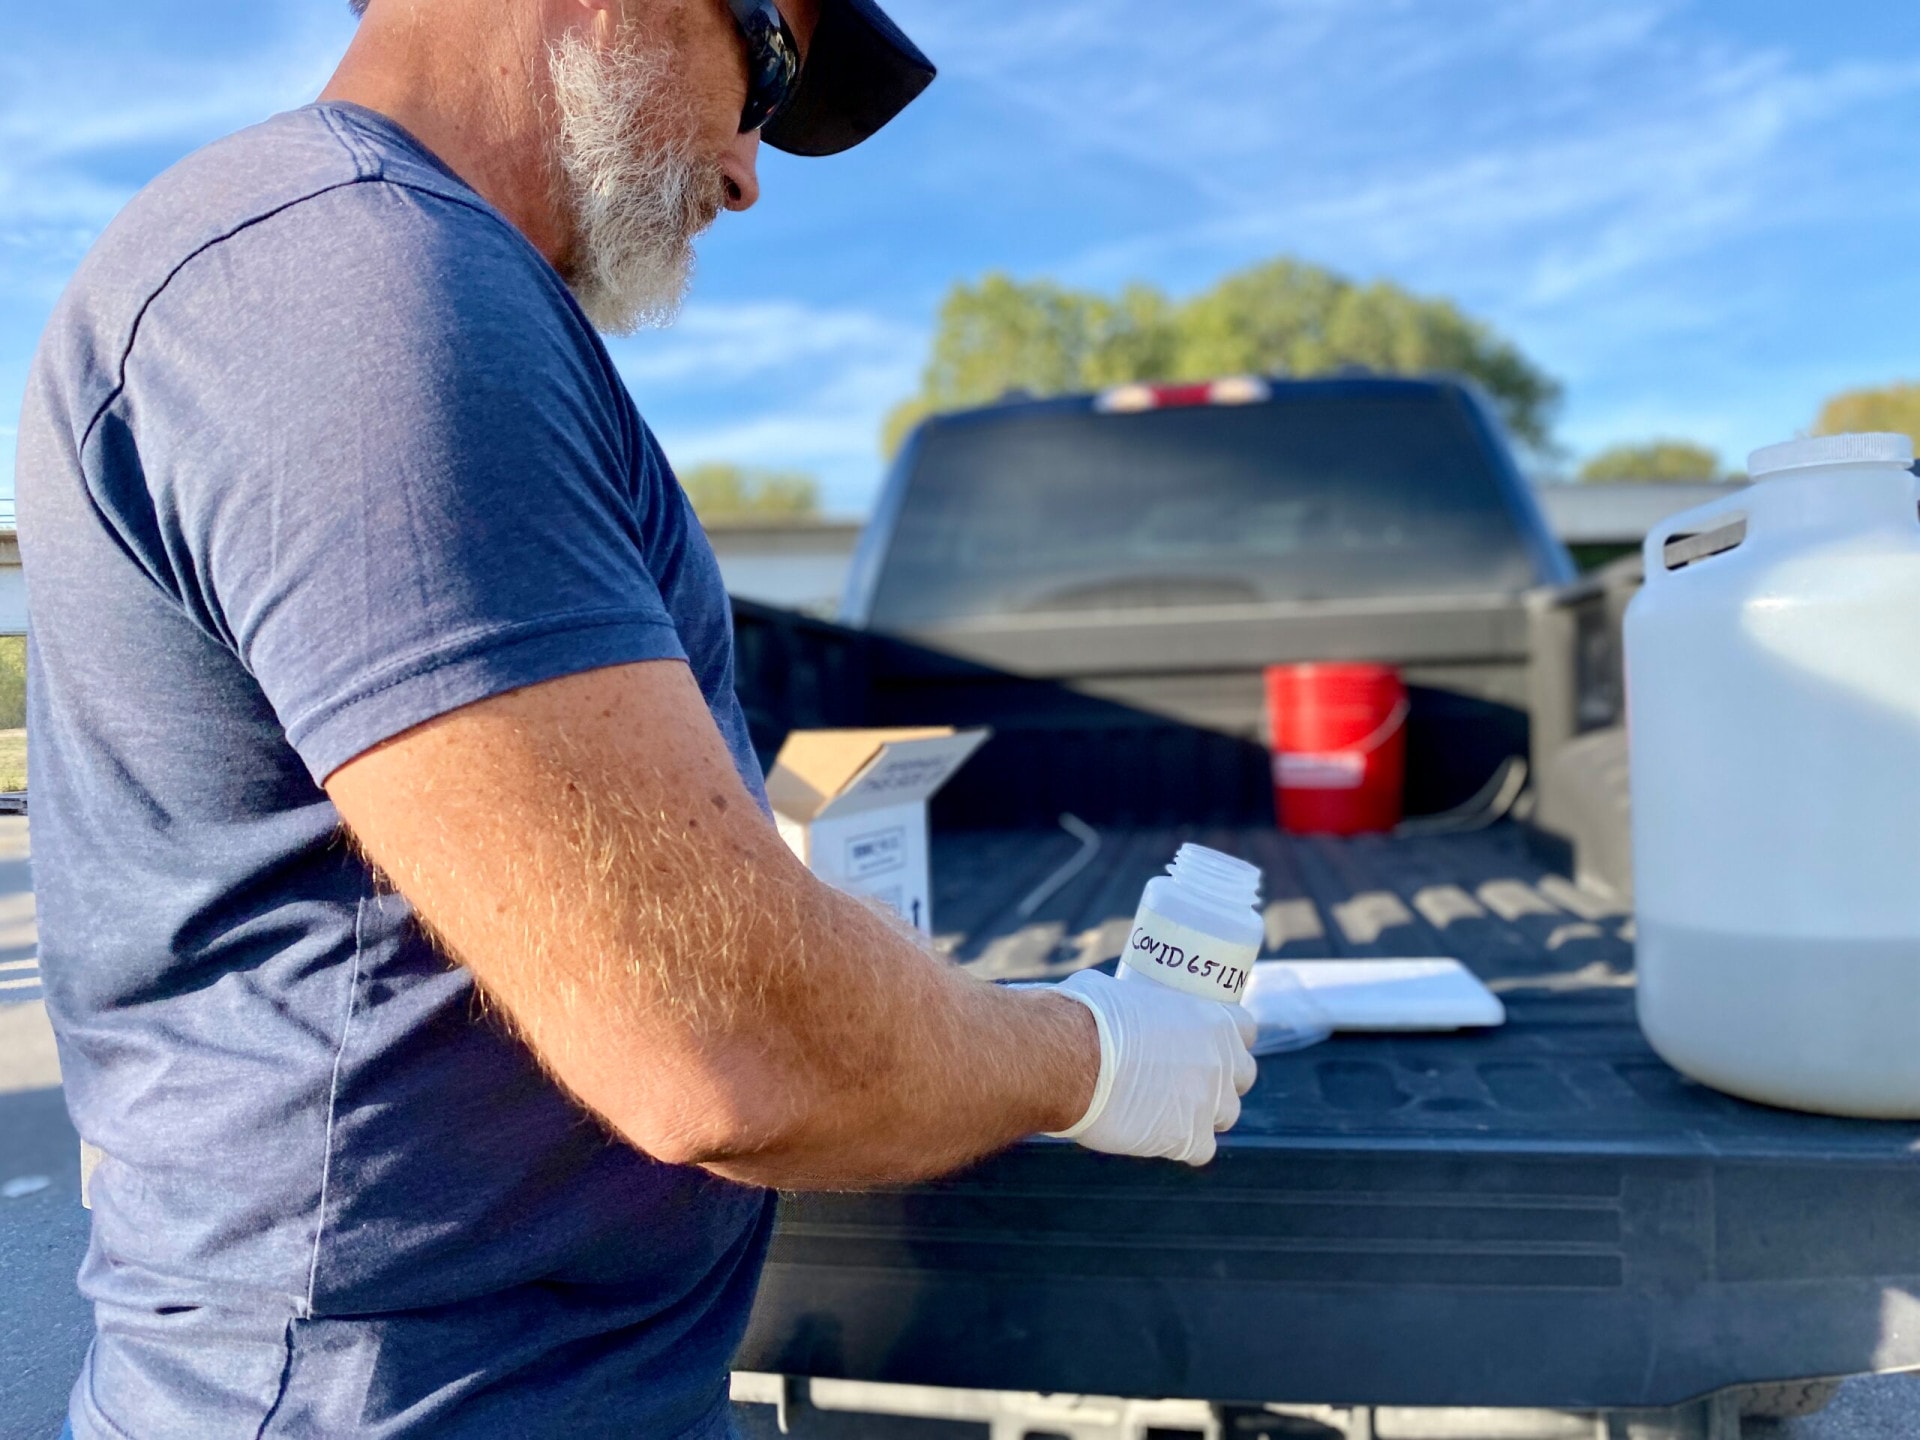
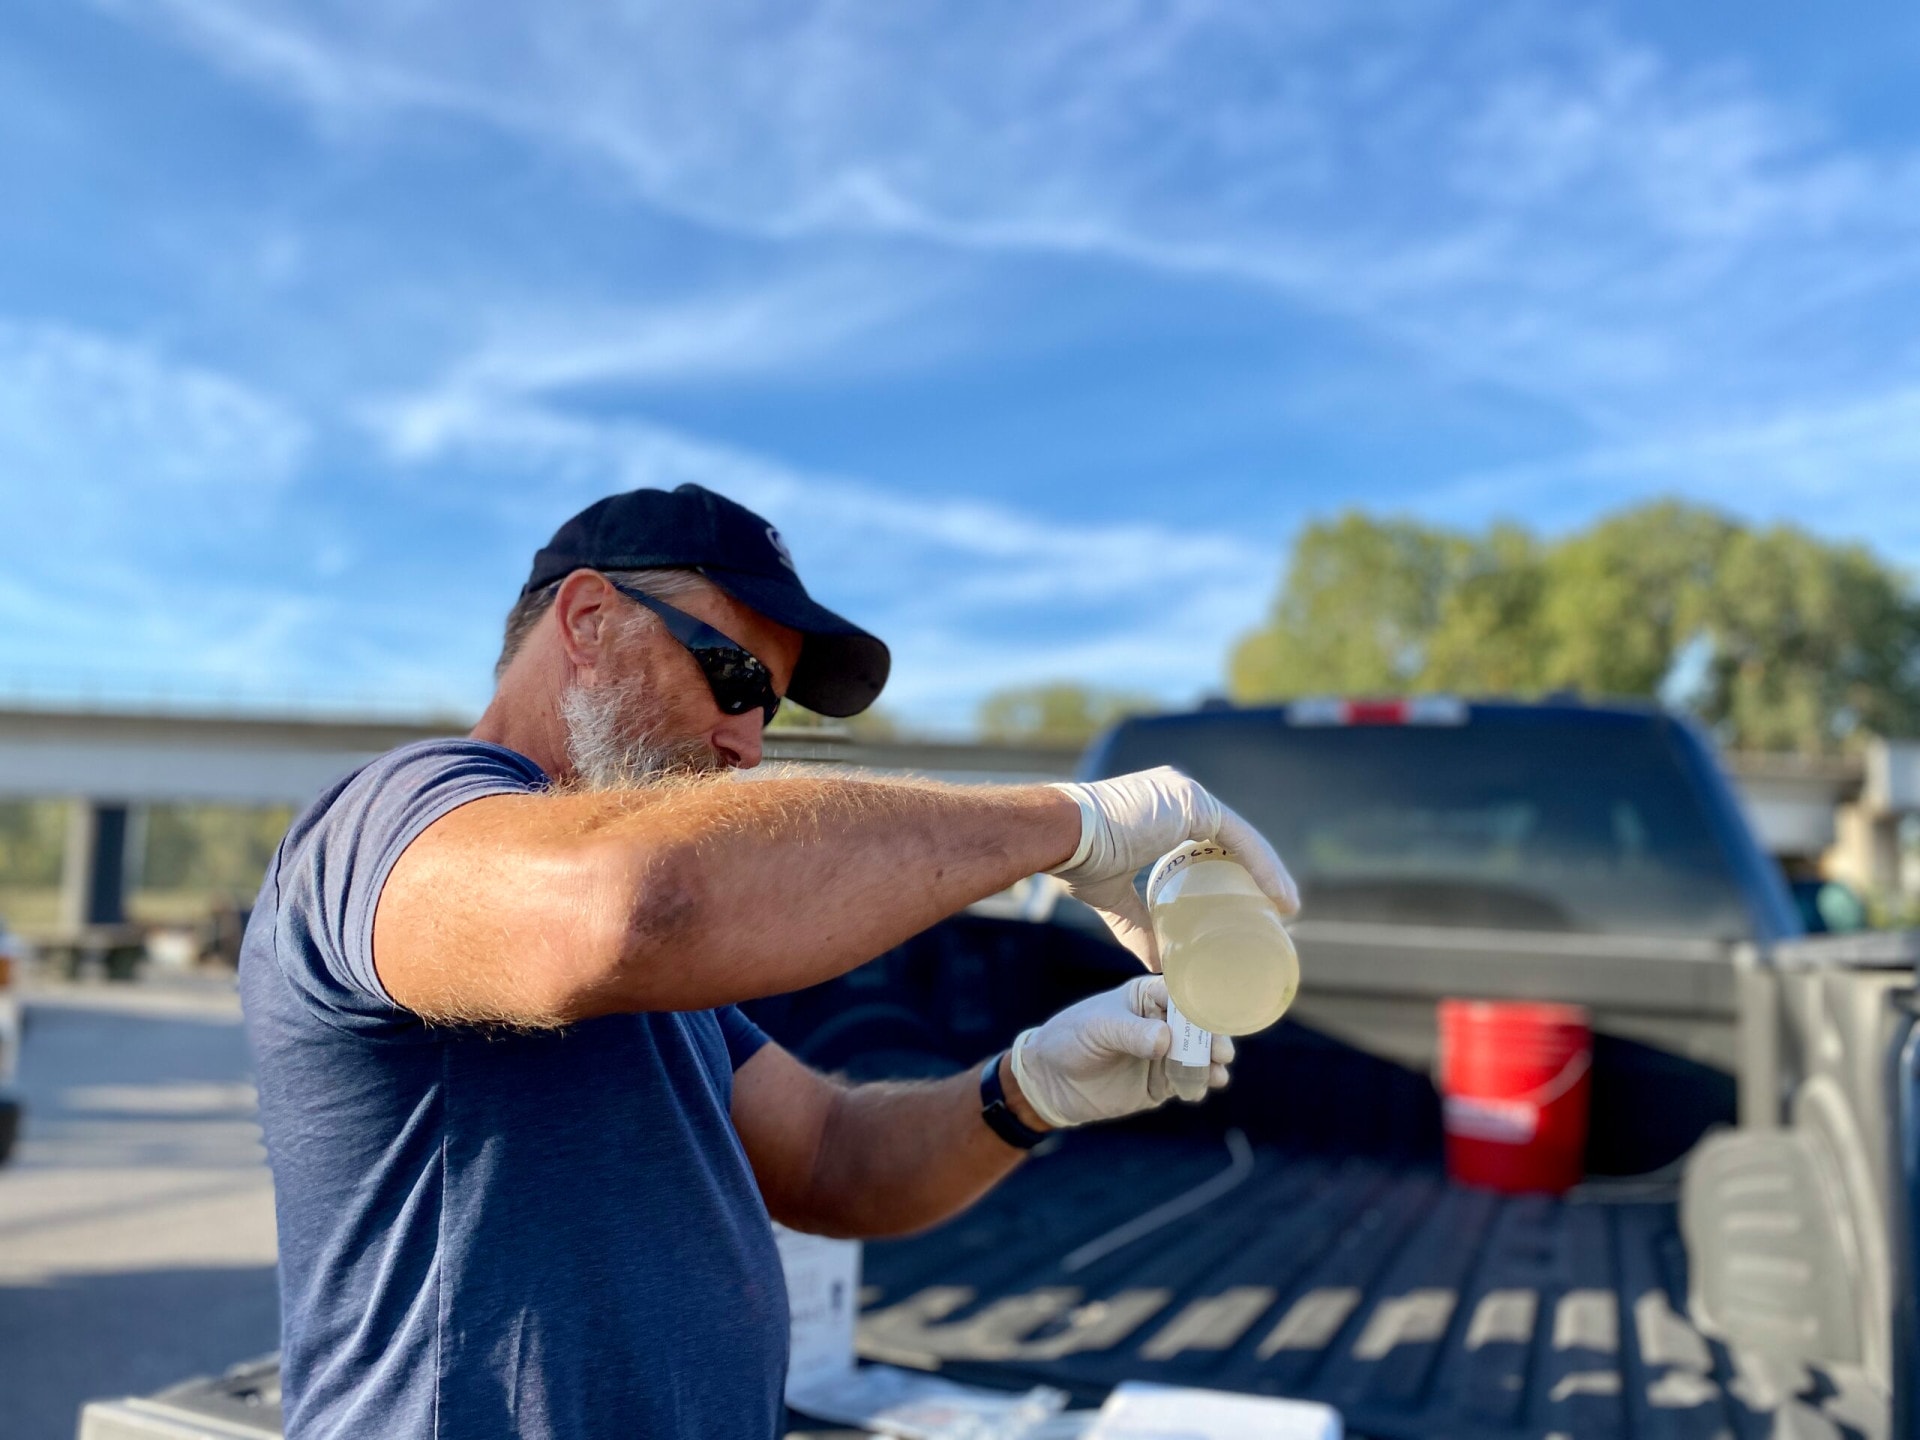
Every Tuesday, about a quarter-cup of wastewater is siphoned into small plastic containers, poured by hand. Time stamped and dated, the health department then ships the bottles to the lab.
“Nothing to it,” said Scott Goins, the senior plant operator who collected the sample that morning.
Step-by-step: Collecting COVID-19 samples with Scott Goins
Complex Problems, Confusing Narratives
As easy as this process looks, tracking COVID was complicated at first.
The way data are collected confused members of the general public who said they were unsure what to do with inconsistent messaging. The Centers for Disease Control and Prevention admitted its missteps in August.
In a statement to the media, CDC Director Rochelle Walensky said: “Our performance did not reliably meet expectations.”
If information is incomplete or interpreted incorrectly, the risks are conflicting headlines and poor public health guidance, writes Raj Dev, a contributing author for TowardDataScience. That happened in much of 2020 and 2021.
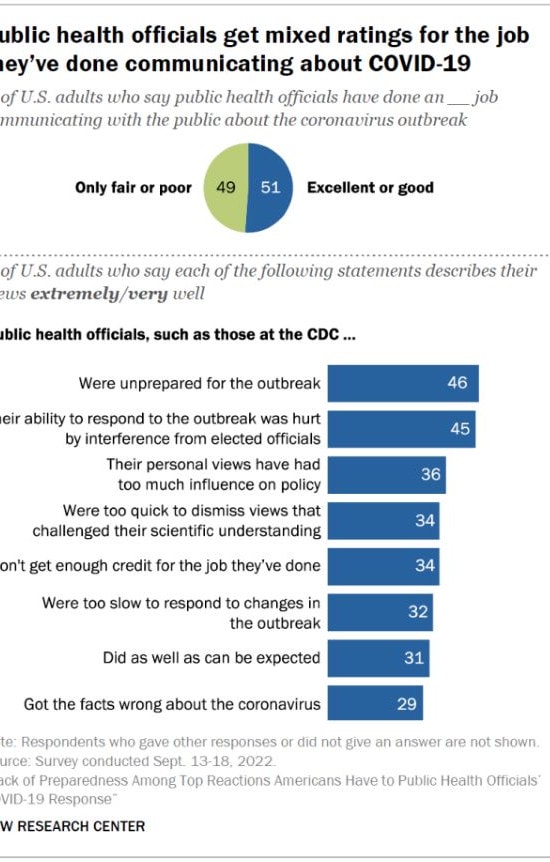
In a Pew Research Institute Survey, nearly half of the respondents said public health authorities were “unprepared for the outbreak.”
These sentiments were echoed across the political spectrum, but were particularly prevalent among Republicans, according to Pew. Communication was the biggest thorn.
These issues were a culmination of problems.
Science communicators blame a few things:
- The inability to track at-home COVID test results.
- Poor public health communication efforts.
- Lack of or unclear access to PCR testing sites.
- City leaders’ more relaxed guidelines in social settings.
Other reasons are partly psychological.
The emphasis health leaders have on guidelines to mask or socialize safely, some argue, matters. Some advocates for health communication say there is still a need for cohesive and clear messages from public health leaders in the region.
Public-facing reports such as COVID dashboards also can be confusing. Moreover, some are incomplete because many county health departments in the Kansas City metro area stopped collecting COVID-19 population and case data. On a larger scale, the state of Missouri stopped publishing some county data in its COVID-19 dashboard in early April 2022.
So, scientists sought to fill the gap.
Information as Power
Roughly two years ago, a partnership between the Missouri Department of Health and Senior Services (DHSS), the Missouri Department of Natural Resources (DNR), and the University of Missouri (MU) was formed.
Together, they launched a program to fill the information gap. It leveraged a more reliable tool: public utilities.
The idea to track COVID in sewers gained traction when they realized how difficult it was to pin down precise case rates with outdated public health reports.
The dominos began to fall early on in the pandemic outbreak.
“We worked around the clock,” said Dr. Chung Ho-Lin, the lead scientist at the University of Missouri-Columbia lab for the Sewershed Surveillance Project. “We have day shift and night shift. We were able to (go to) development within almost two weeks.”
Jeff Wenzel, the lead epidemiologist, took the helm along with Ho-Lin. Wenzel and his team set out to collect samples of wastewater, which researchers at the university could study in a lab.
They specifically looked at the viral load of SARS-CoV-2 in wastewater. This method took the science world by storm. It was able to track the pandemic with more clarity.
“Starting in the beginning of last year, January, February of 2021, we started looking at variants and whether or not we could see what variants were present in a community,” Wenzel said.
The Sewershed Surveillance Project team would track community transmission and how variants were circulating. The higher the viral load, the more likely it was that cases would increase.
“Whenever we see an increase in viral load of 40% or more from one week to the next, that’s an indication that we will see a significant increase in known human cases from at least 25% — with 70% probability,” Wenzel explained.
Epidemiologists study wastewater to detect changes in population or disease case rates and have even been able to detect new variants.
When an Omicron subvariant emerged, called B.A.5, Wenzel saw the uptick reflected in the data. As of October 2022, this subvariant makes up 62% of cases, and this project saw its increasing prominence as it was happening.
In the past two years, the Sewershed Surveillance Project grew to include 100 communities in Missouri that covers almost 70% of the population. The sample pool was ideal, capturing a more accurate census.
Sometime in March, the CDC’s National Wastewater Surveillance System (NWSS) outlined the benefits of early detection.
“The virus can then be detected in wastewater, enabling wastewater surveillance to capture the presence of SARS-CoV-2 shed by people with and without symptoms. This allows wastewater surveillance to serve as an early warning that COVID-19 is spreading in a community,” according to the NWSS.
The wastewater data were showing numbers that PCR tests did not. It was comprehensive and matched the real-world dynamics physicians saw in their hospitals.
In Kansas City, the benefits of wastewater surveillance were clear.
The Blue River wastewater plant is the largest in the region and serves nearly 80% of the Kansas City metro area, said a city spokesperson.
COVID-19 Trends in Wastewater
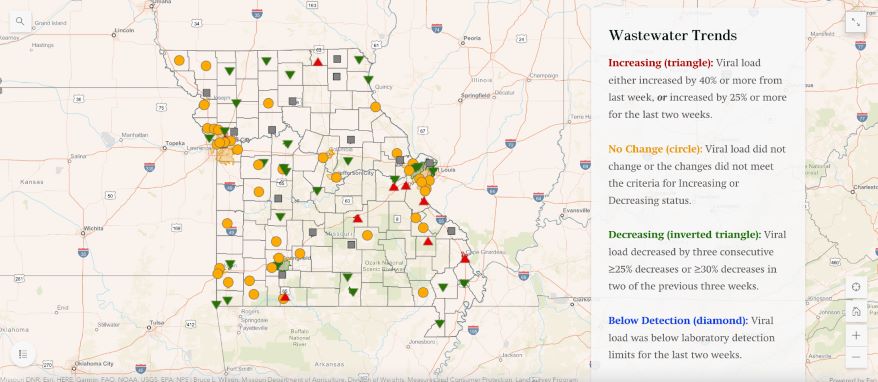
Wastewater provides a more comprehensive look at what’s circulating in the city than self-administered tests, epidemiologists say. Not all home tests are done correctly and not all results are sent to the health department for tracking. This leaves gaps in crucial health data that public health leaders rely on to make their next call.
Wastewater testing is more effective because everyone in the metro area uses bathroom facilities. Samples from there can give experts more accurate COVID rates, all in real-time. For instance with daily data updates, people can check the map, see if there’s an increase and delay a trip if needed, Lin said.
The resulting data derived from human sludge reveals a clearer picture. This work has been a quick, heavy lift for Wenzel, Lin and the group of 10 researchers.
But it takes science from the lab and into the real world. For Lin, that’s the power of this partnership.
Though usually holed up in a small office, stacked to the ceiling with papers, this project gave the Missouri scientist a purpose. It isn’t every day that a lab study informs what’s happening outside, in the real world.
“I was able to witness this whole project from scratch. It is very rewarding to be a scientist,” he added.
Cracking his lips into a smile, Lin says knowing more about COVID in the day-to-day should not instill fear, but rather empower people to live more safely and happily. And he had one final message.
“Science in higher education can be powerful,” Lin said.
Vicky Diaz-Camacho covers community affairs for Kansas City PBS.


